Graphs
Here a some graphs I had fun creating from my pictures. They were created using R, and browsing various tutorials.

One thing I would like to do, but I haven't figured out yet, is to split each graph up per camera.
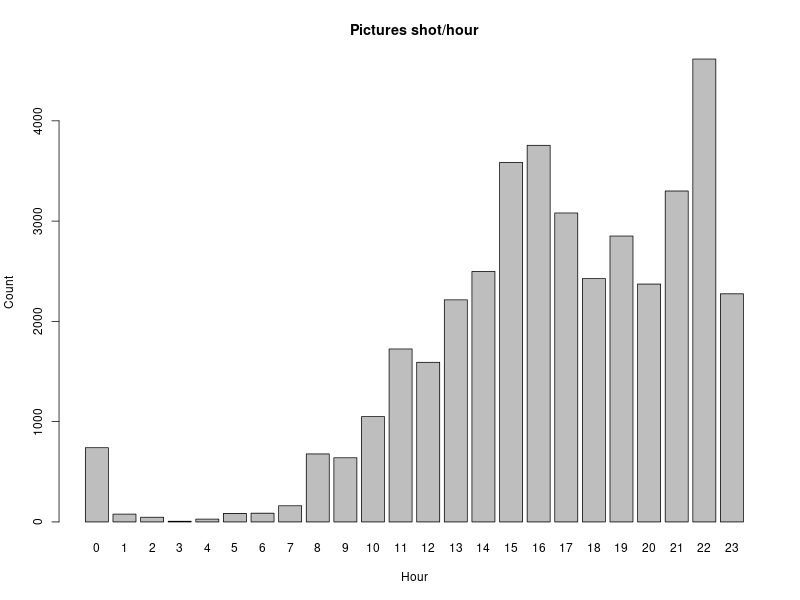
The peak around 21-23 is probably
concert-photography - many pictures taken in a short amount of time.
Not really the early bird, I am.
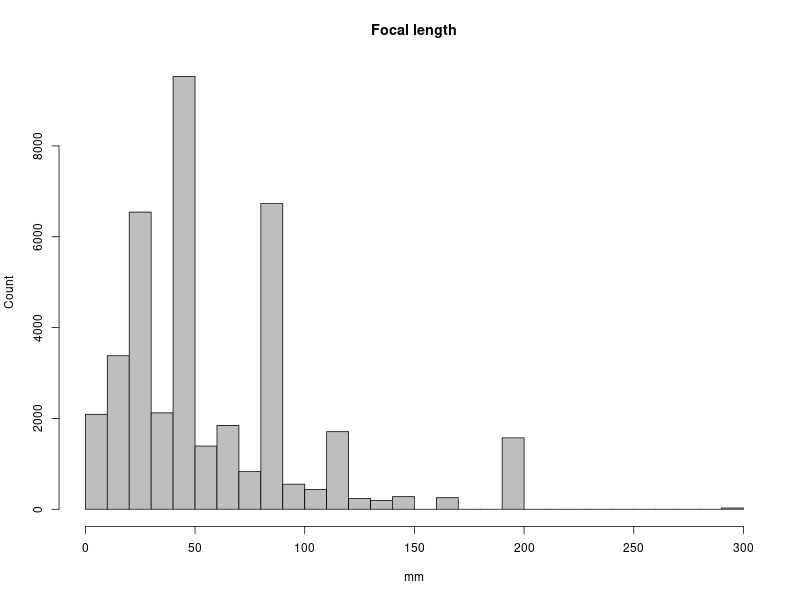
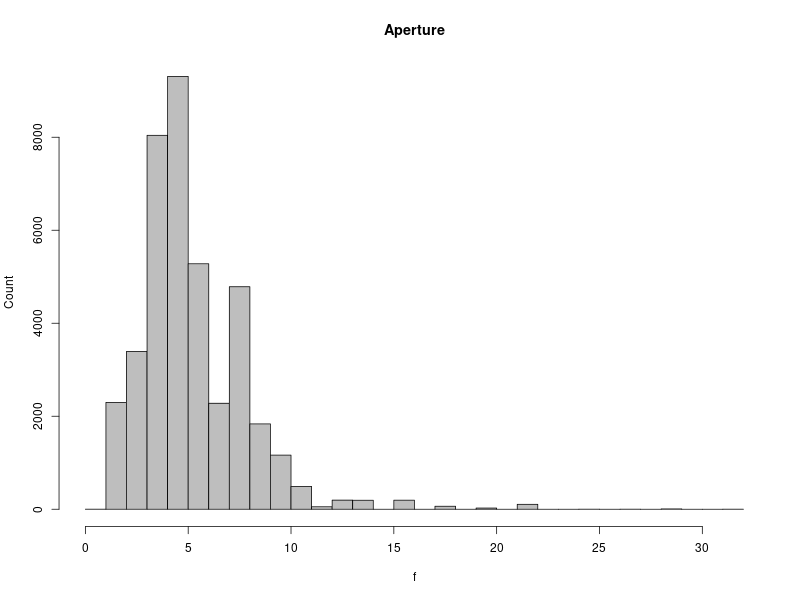
The peaks seem to be at the end-points of the zoom-objectives I have
used. The very short ones are due to the compact cameras, and the
300mm was one I just tried for 5 minutes.
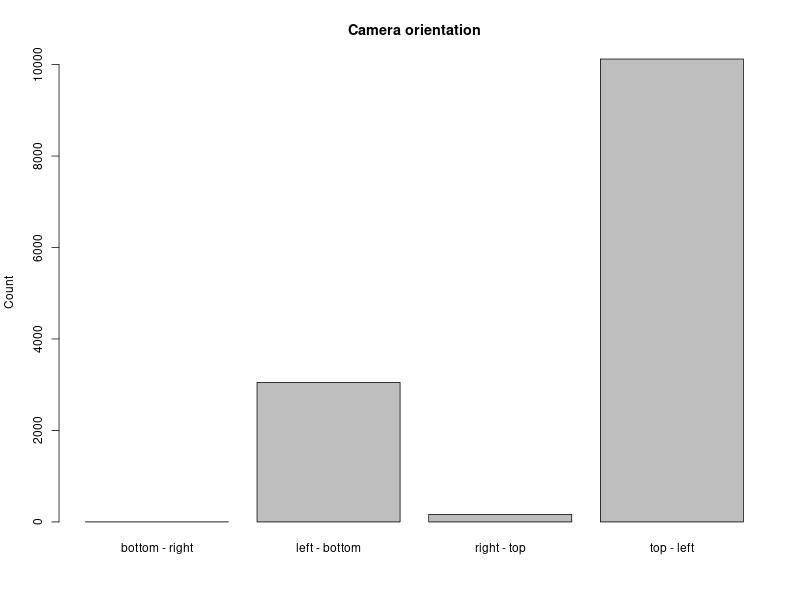
I didn't turn the camera much until lately. Also I started turning
it the other way, so the other eye doesn't look straight into the
camera, if opened (I guess).
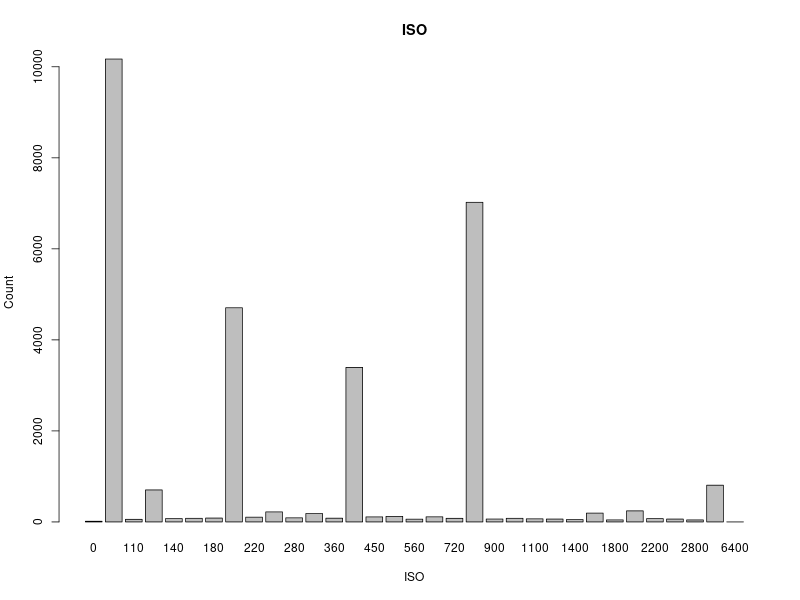
The 400 andd 800 peaks are concert-photography. 200 is due to my old
camera and 100 the new.
I usually let the camera decide, so I guess the peak just says many
pictures in low light.
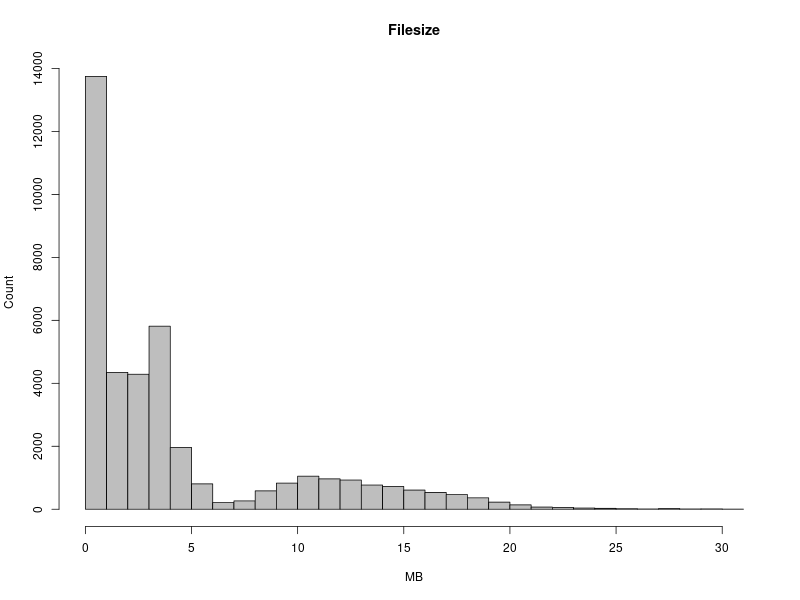
Due to the mix of cameras this distribution looks a little funny, I
guess. I shot on "Normal" quality for a long time, but changed to
"Fine" as CF-cards got larger.
(I shoot JPEG, I have never bothered to configure dcraw to convert RAW images well, and I am way too much a non-professional for it to make a difference and for me to bother.)
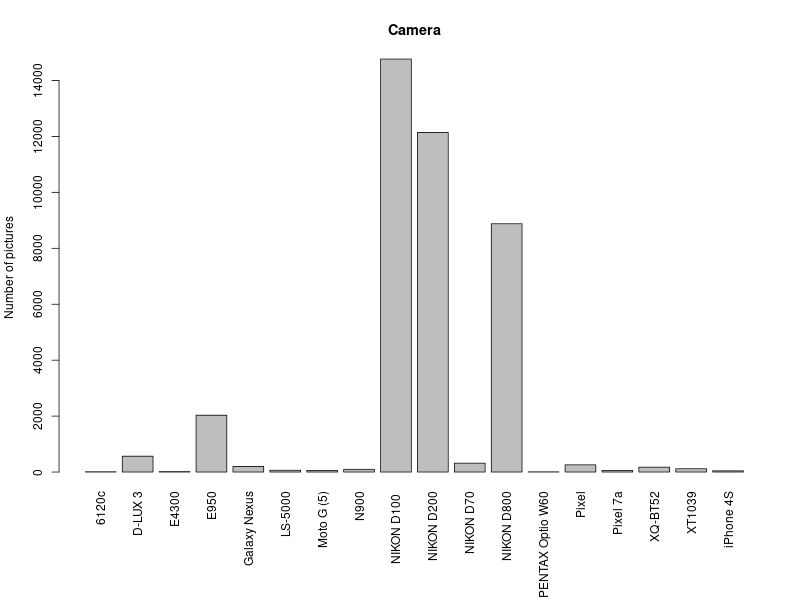
The old D100 still dominates the D200 slightly.
The (Nikon) E950 was my first digital camera.
The (Leica) D-Lux 3 was the first time I mistakenly thought I'd like to use a pocket camera. The Pentax Option W60 was the second time I made that mistake - less expensively, this time, though.
It is easy to see that I rarely take pictures with my phones: (Nokia) N900, Galaxy Nexus, (Nokia) 6120c (work), (Motorola Moto G) XT1039.
The D70, (Nikon) E4300, and iPhone 4S aren't mine.
If I ever learn some more R tricks, I will try to get some more fun out of the numbers.